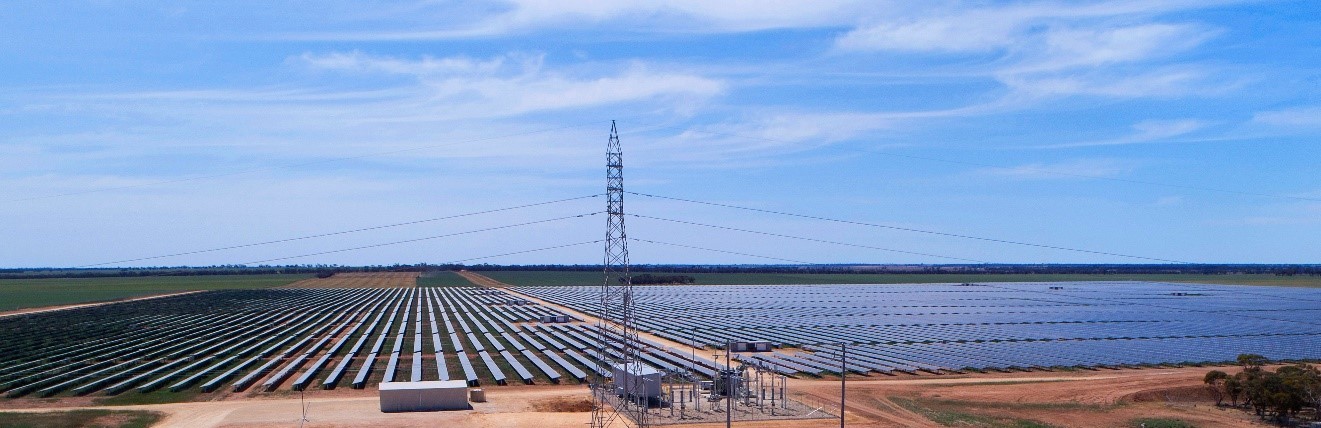
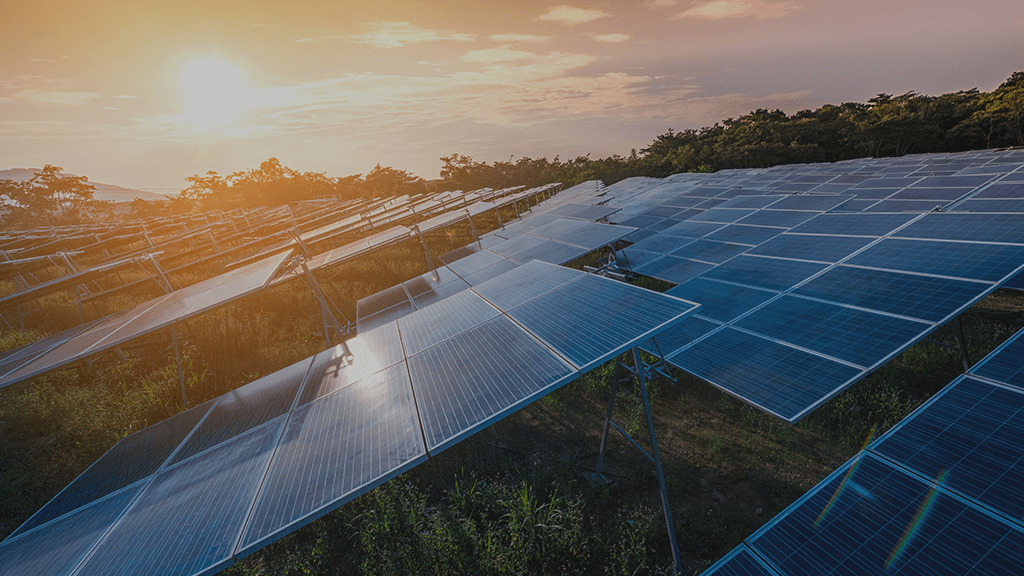
Elgar Middleton are pleased to have advised DIF Capital Partners (“DIF”) on the financing of their UK-based solar generation and battery storage portfolio.
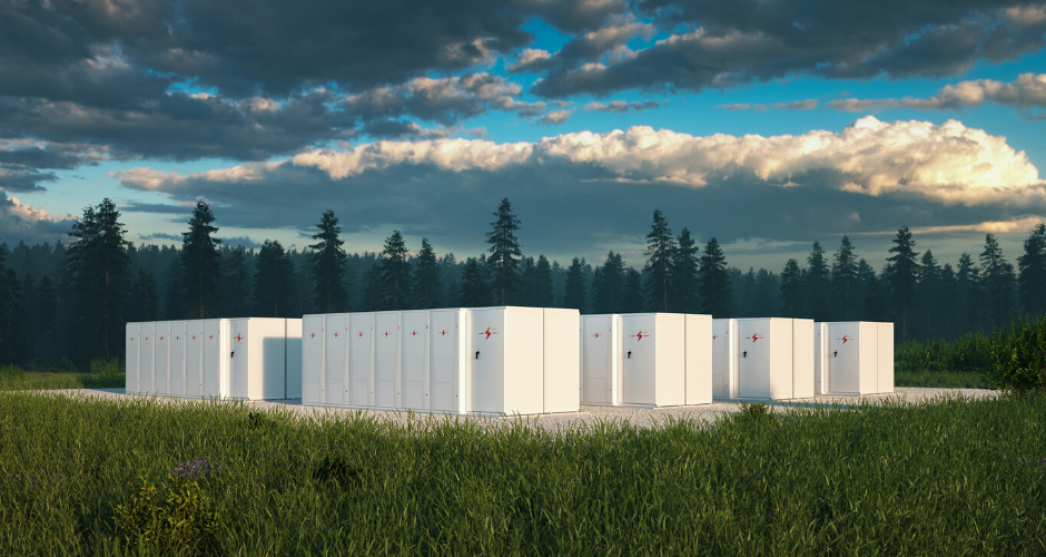
The portfolio consists of seven ready-to build assets equating to a total capacity of 720MW of which 380MW is solar and the remaining 340MW is BESS. Elgar Middleton facilitated the senior debt financing of the first 540MW of the portfolio. The financing encompasses not only senior debt, but an equity bridge loan provided by the group of senior lenders (ABN Amro, ING, Rabobank, NAB, KFW and Lloyds) and an accordion facility to enable the build of the final 180MW of the portfolio.
The first two projects within the portfolio are under construction, with an expectation that all projects will be operational by 2025.
This co-located solar/ battery storage portfolio was acquired by DIF in November 2022, 10% is owned by ib vogt with the remaining 90% sitting within DIF Infrastructure VII fund.