There is much debate in the mainstream media about the cost of generating electricity from renewable sources. The underlying belief often being that green = expensive. But is this necessarily true? In light of this debate, William Evans looked at daily data from 2020 and in his article below, explores the relationship between wholesale electricity prices and the carbon emission intensity of the UK’s electricity production.
The results are clear, green (by which we mean low carbon intensive) electricity was in fact the cheapest electricity delivered to the grid network no matter which month you review.
But does this tell the whole story and are we in fact already seeing the start of supply & demand forces driving prices down when renewable generation peaks? Whilst this may be good for the consumer it raises some immensely difficult questions for these low carbon generators that need addressing, otherwise they may quickly witness a collapse in their underlying economics.
How to determine what is green electricity?
A great deal of data exists in the public domain about the UK’s electricity generation. Two of these data sources have been used as the basis for this analysis. The first is the carbon intensity of the UK’s electricity, the second is the price that electricity is sold by the generators to the grid network.
-
- Carbon intensity – data produced by National Grid provides the CO2 emissions on a half hourly basis. The data is presented in units of gCO2/kWh, essentially telling you how many grams of carbon dioxide are released for every kWh of electricity produced in the UK. The lower the better; with high solar and wind generation it is <100; whereas when gas and coal is predominantly being used it is often >300. In reality, the value is somewhere in the middle due to the blend of different generators being employed at any point in time.
- Wholesale price – the price paid by the grid to a generator can be broken down into half-hourly segments and is measured in £/MWh. For clarity this is the wholesale price paid to the generator and should not be confused with the price paid by a consumer, the differences include government subsidies (as summarised in this article’s footnote), grid costs and the costs assumed by the retail supplier. The wholesale price is dictated by classic supply & demand forces, with over-supply of power driving the price down and conversely a lack of supply will result in a power price spike. To account for this many gas and coal powered generators are on standby and only generate when prices climb (often as it would be uneconomical to run with a lower price) thereby helping to balance the supply.
By comparing the two data sources outlined above you can determine if there is any relationship between the wholesale price paid for the electricity and its CO2 emissions. Elgar Middleton’s analysis is based on a daily average for each data source. The average is not weighted and is based on the ‘mean’ of each day’s data.
UK electricity production in 2020
The chart below plots the two variables for all 366 days in 2020. Carbon intensity on the left-hand axis, wholesale power price on the right-hand axis.
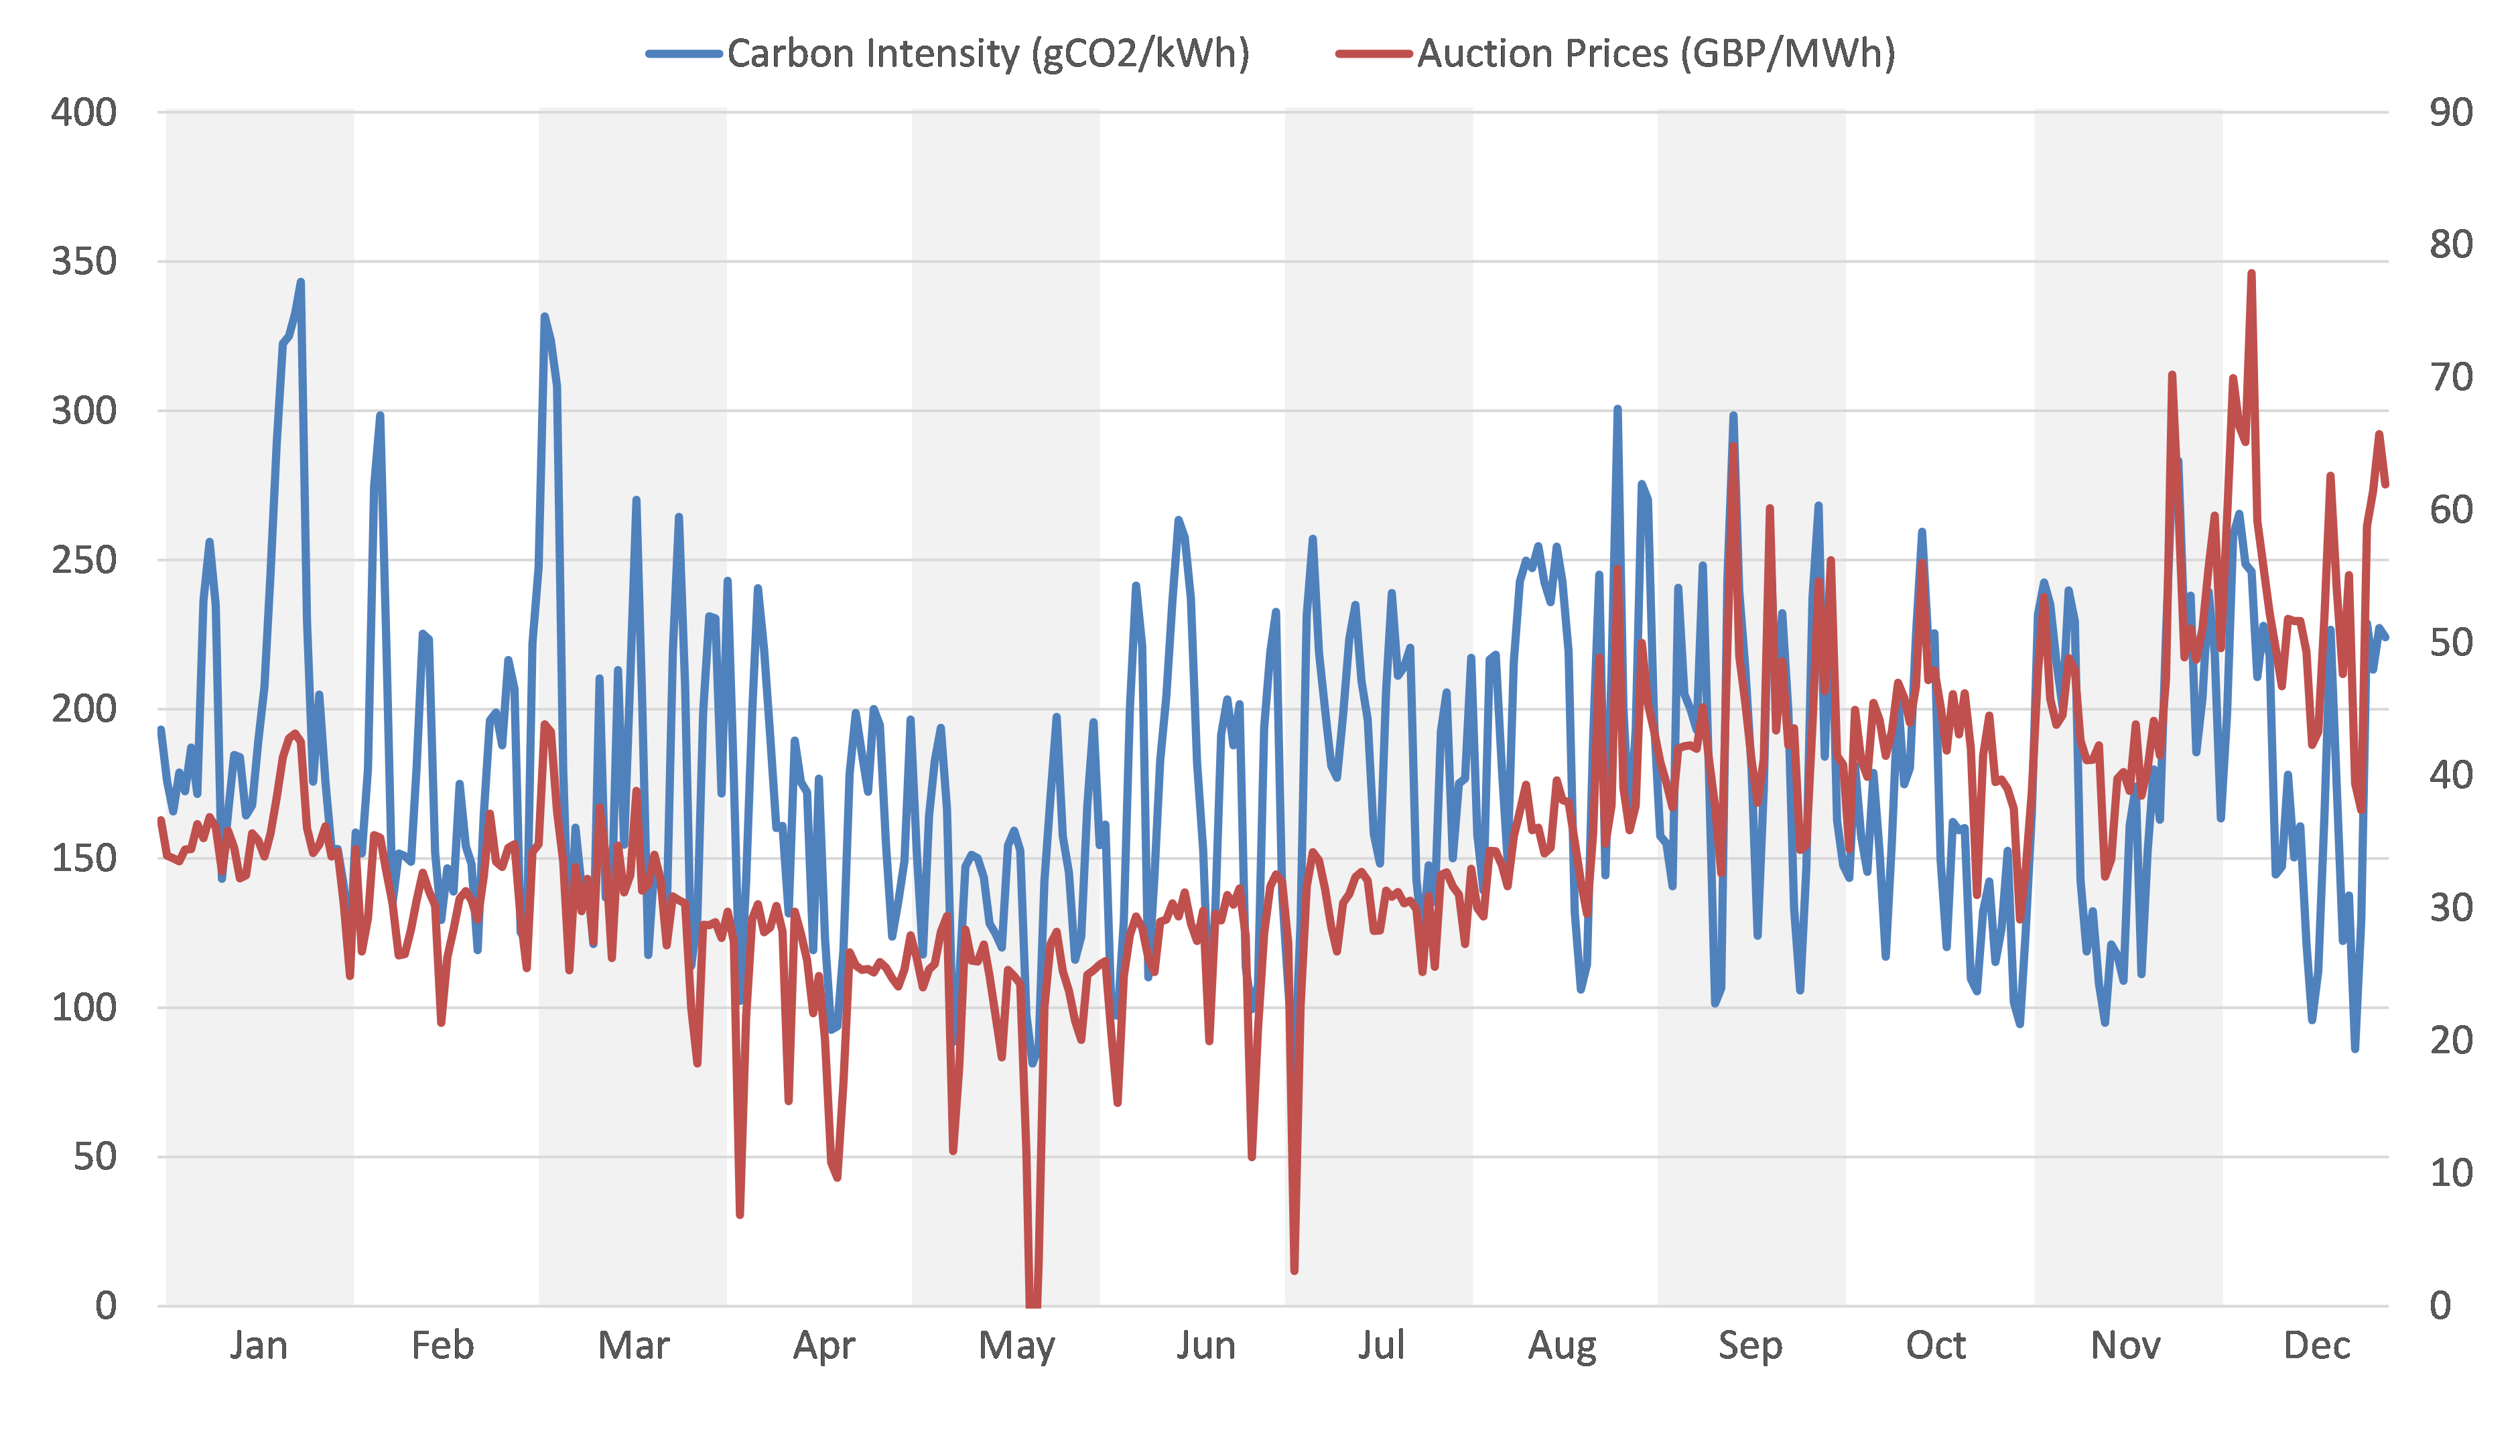
At first glance it is hard to see any patterns as both lines experience substantially short-term volatility. That the power price (red line) is higher in the winter months than summer is to be expected as more lighting and heating is required at these times. Trends in the carbon intensity (blue line) are however harder to immediately see.
To try and clarify this, the data can be viewed in a different way, namely by smoothing out the volatility using a 7-day average. This simply takes the ‘mean’ average wholesale price & carbon intensity for the past 7 days. The results are displayed below, note that the axis have the same units but a different scale to the chart provided above.
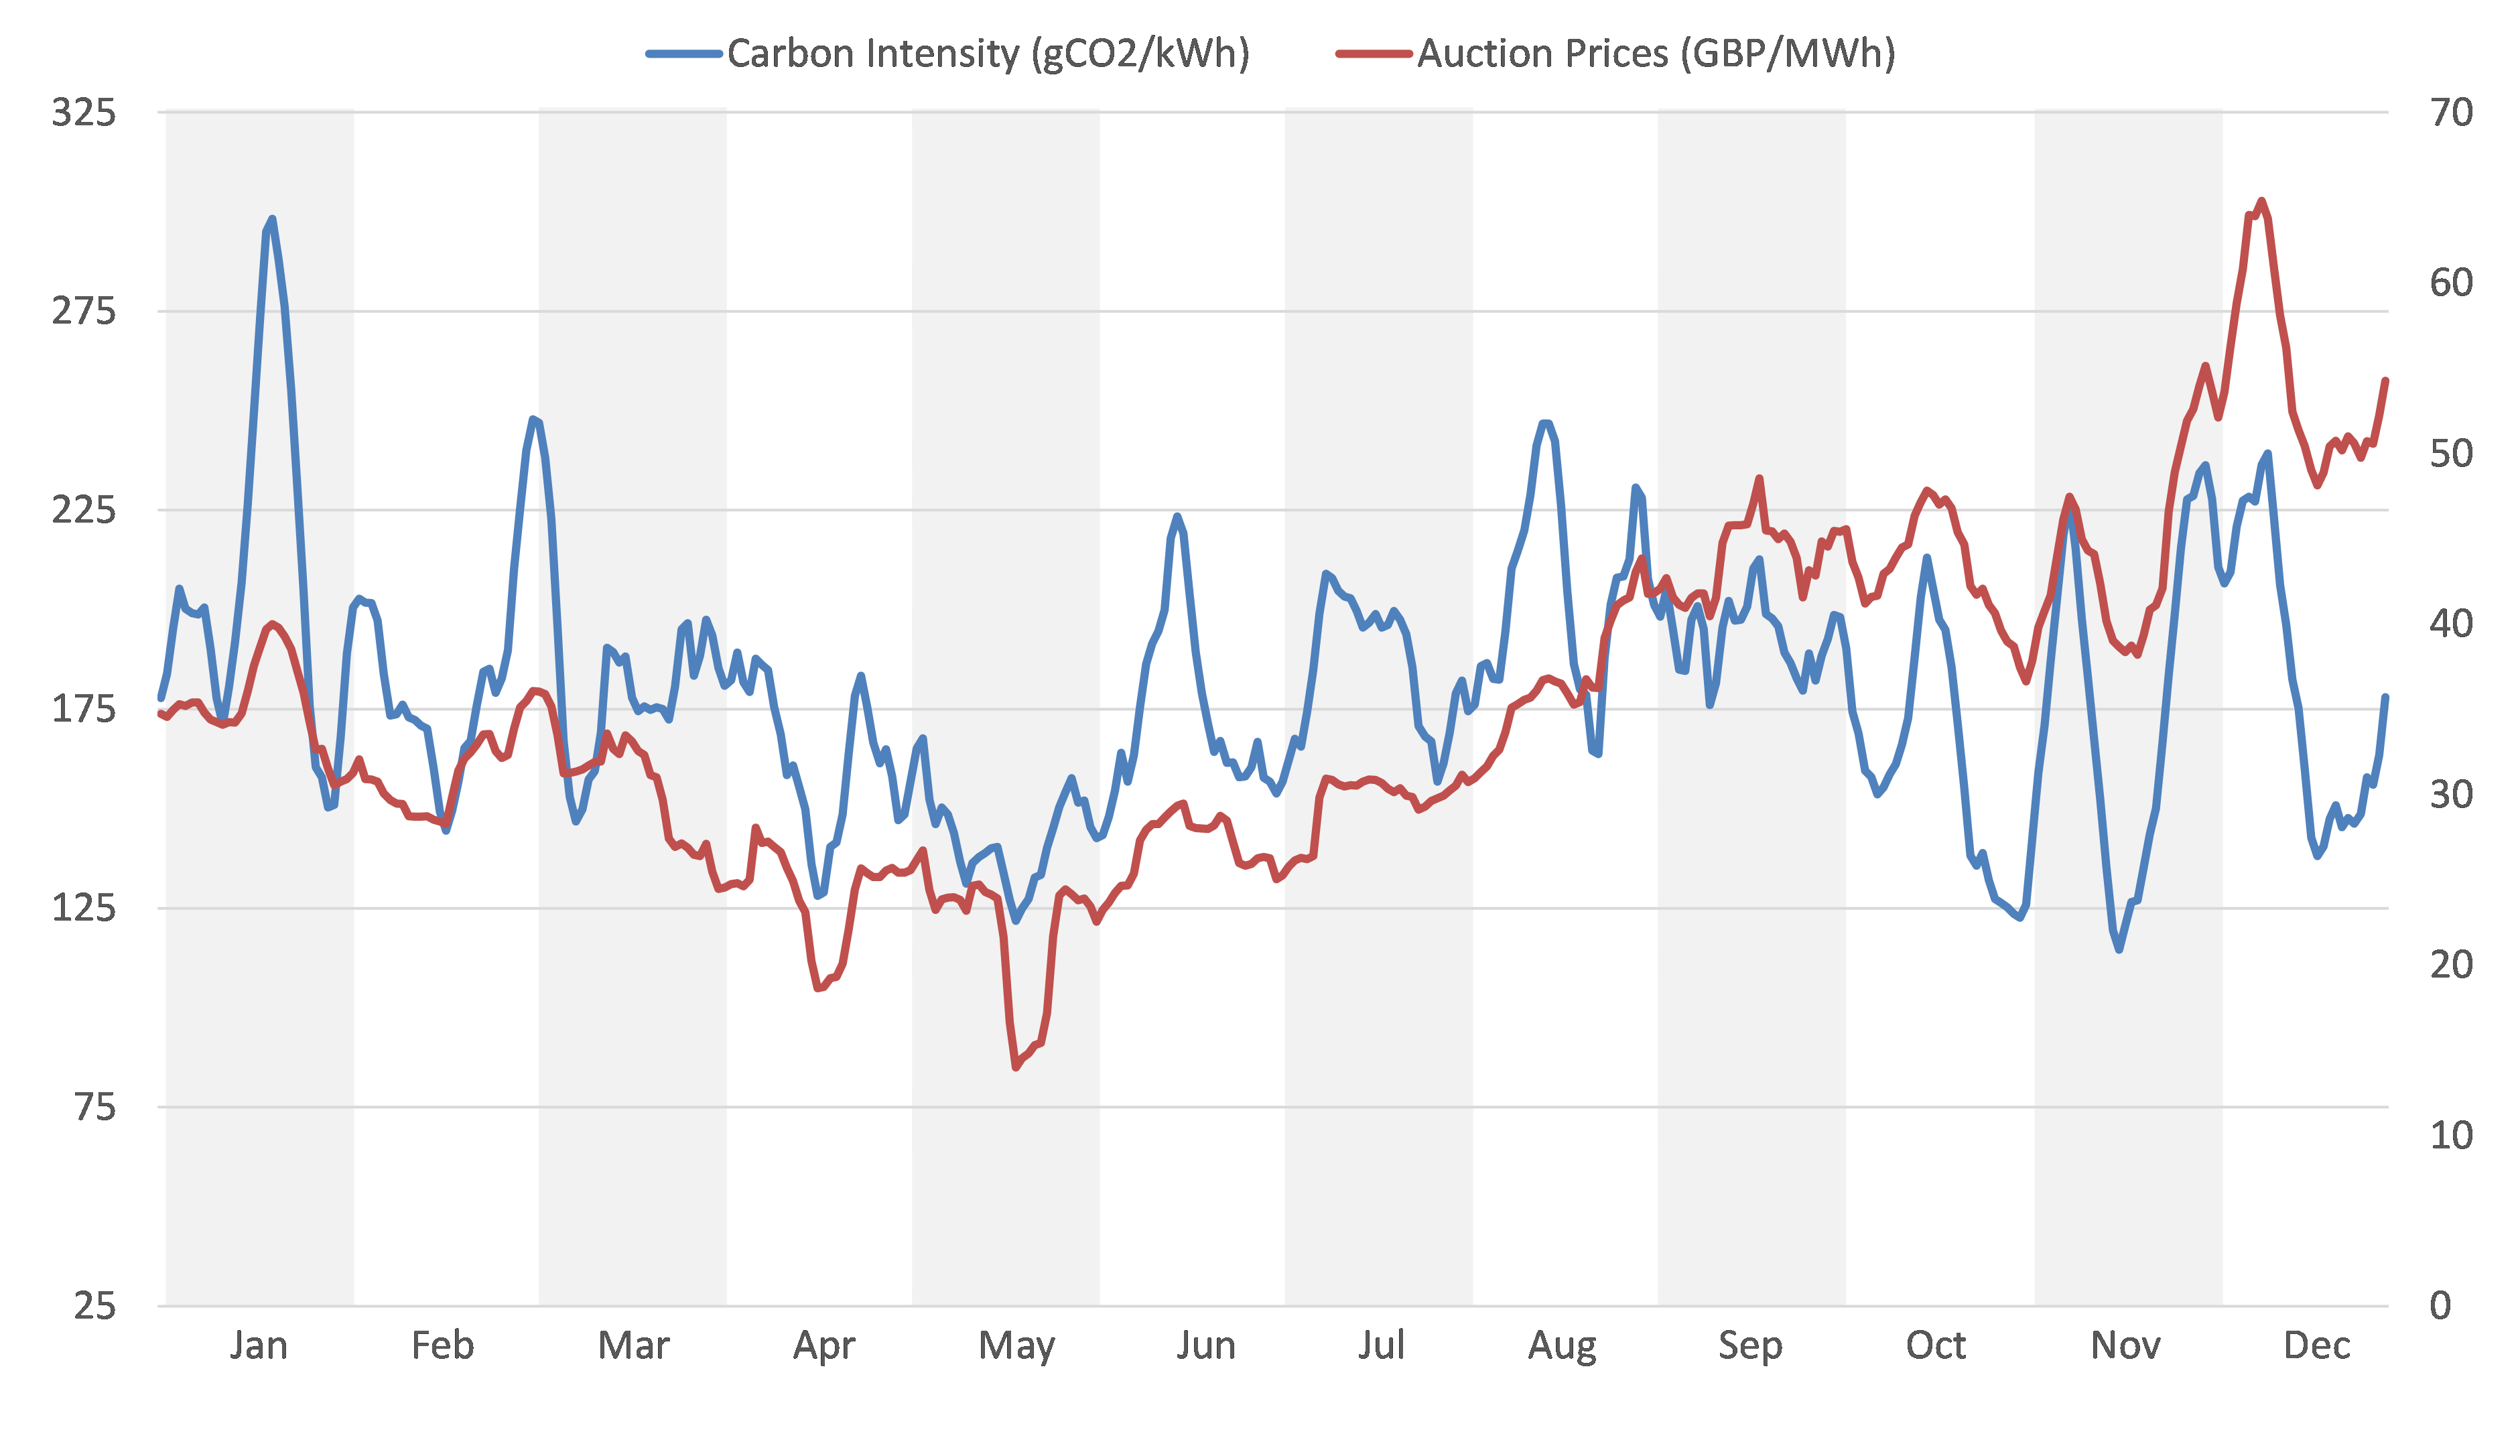
When viewed in such a way it appears that there is a correlation between the two variables. Namely that the UK pays a higher wholesale price for electricity that has a higher carbon dioxide output. Conversely it is clear that in months such as May 2020, the power was not only low in carbon dioxide emissions, but this was also the month with the lowest power price. This correlation is not just on a macro scale of monthly trends, but is also witnessed in short term peaks and troughs.
Determining the correlation
Whilst comparing lines on a chart is a useful visual aid we can also test our intuitions mathematically, for instance by measuring the correlation between two variables. A strong correlation between cheap power and green may not prove that they always occur together but would get us over the first hurdle of demonstrating that they are related to some degree.
A ‘correlation coefficient’ measures if two variables are positively (both move in the same way) or negatively (move in opposite directions) related. This is represented by a value denoted ‘r’ which ranges from +1 to -1. As the earlier charts suggest a positive correlation, we shall just consider the r values above 0. These are expressed as follows:

The correlation coefficient was calculated for each month’s data based on the daily values (i.e. the data presented in the initial chart). This means that each r value is based on 29-31 data points for the two variables (noting 2020 was a leap year). The outcome was as follows.
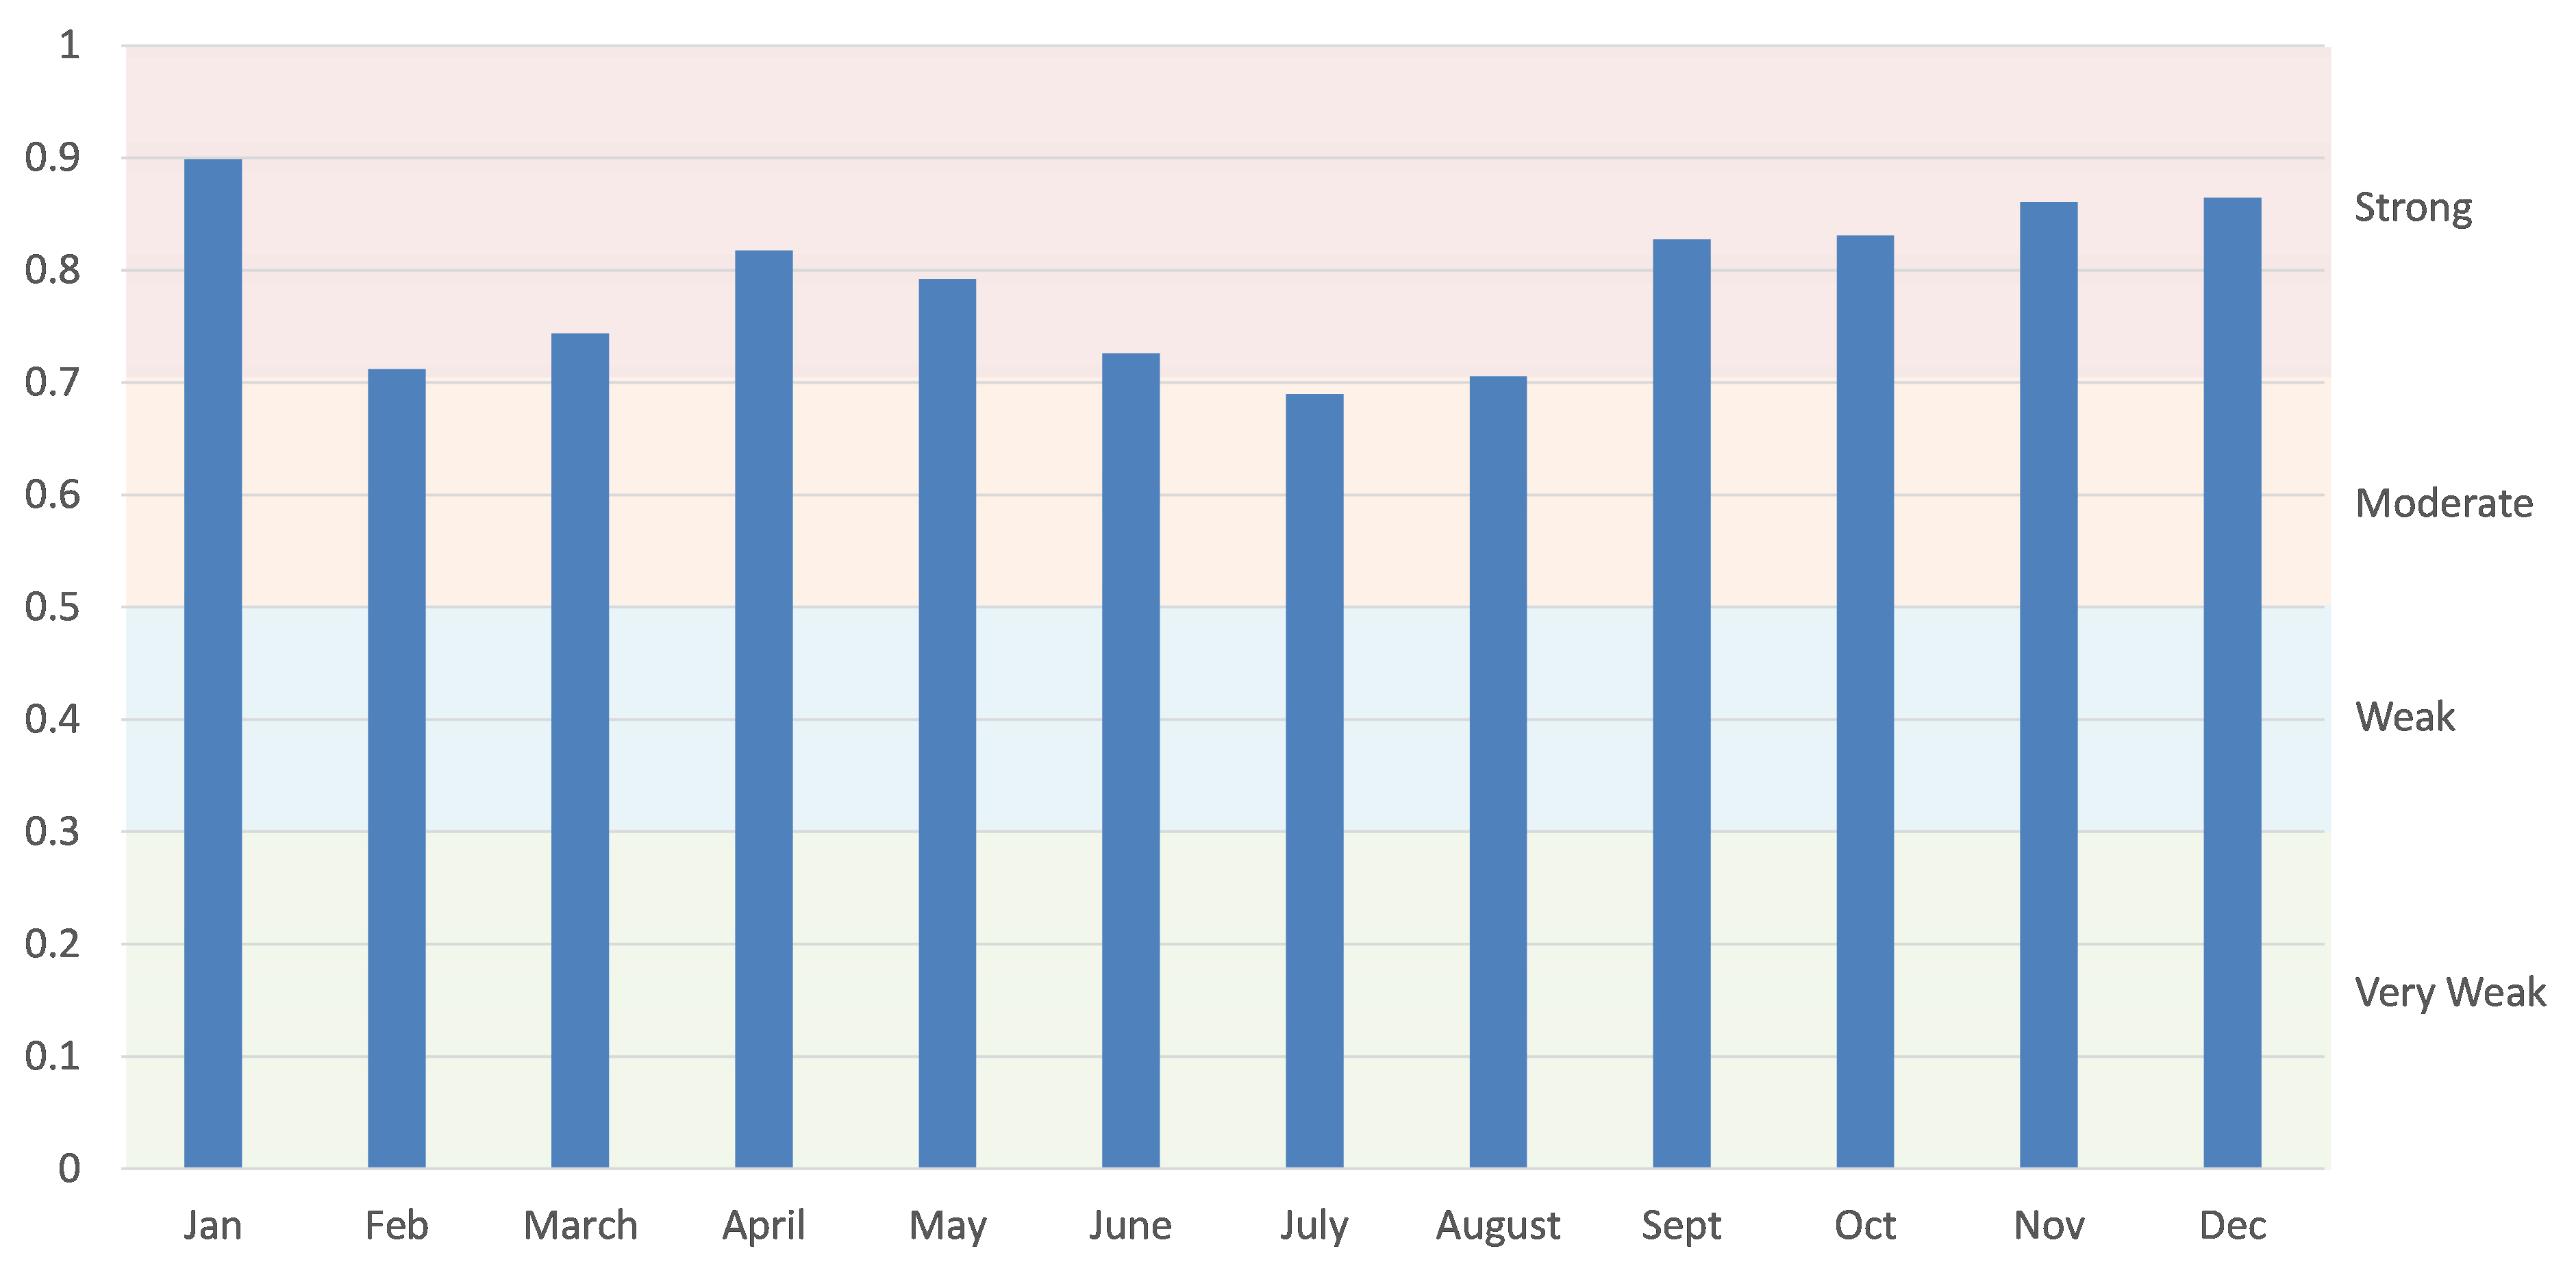
This analysis shows us that in 11 months of 2020 the correlation between movements in the wholesale power price of electricity to the carbon intensity of that same electricity was “Strong”. The only month where this did not occur was in July, but even then, the r value was 0.69, meaning it was at the very top of the “Moderate” range.
This confirms that there is a strong correlation between the electricity wholesale price and the carbon intensity of the electricity generated at that point in time and conversely that low-carbon electricity comes with low-cost electricity.
Green power is cheap power, but is that actually a surprise
Is it then right to conclude that low carbon electricity should be regarded as delivering the cheapest source of wholesale power to the UK grid network? This looks reasonable, at least in the wholesale markets; the correlation is strong and is backed by a strong narrative – that much of the low carbon electricity that finds its way to the grid is generated at almost zero marginal cost, and it should come as no surprise that power that is cheap to produce is also cheap to consume.
There can also be no doubt that knowing that, when we generate the lowest carbon intensive electricity wholesale prices are also at their lowest, is anything but positive. It is a message that is crucial in further strengthening the relationship between the renewable energy sector, the general public, as well as the political class. It is undoubtably therefore a message that should be widely shared and celebrated.
But there is another side to what this data is telling us. As noted before, the power price is driven by supply & demand forces. Focusing once more on the supply side it has long been recognised that the supply of electricity from renewable sources is volatile and dependent on external forces. For wind turbines it is the strength of the wind, for solar it is the passage of the sun (creating daily fluctuations) as well as the length of the day (seasonal fluctuations). It is therefore no great surprise to see that periods with low carbon output are the same periods with low prices. All that is happening is we have lots of wind and sun … which generates lots of power at essentially zero marginal cost … which pushes the market price down.
The steady increase in the UK’s low carbon generation has made this supply & demand relationship ever more volatile. We now have a situation on particularly sunny and windy days where the power price has been driven so low that it is turning negative, meaning a user of power can actually be paid to consume electricity from the grid, an almost unheard-of concept only a few years ago. This over-supply of power from renewable sources will only become more pressing as we continue to connect more offshore wind farms and more solar installations onto the grid.
The challenge and the potential solutions
To some, the idea of power prices being pushed even lower will be seen as fantastic news. But sadly it isn’t that simple. The higher the proportion of power generated by low carbon sources is, the greater the inherent volatility will be in our grid. The resulting spikes and troughs in wholesale prices each have their own issues:
-
- The power price spikes – when low carbon power is not available, the supply drops and the wholesale price rises. This is when existing back-up generators kick in. As these back-up generators are typically based on the combustion of gas and coal, the carbon intensity climbs and the spikes are aligned. This is bad for the general public’s wallet and their health.
- The power price troughs – As noted earlier, high output from renewables increases the supply and drops the wholesale price. But developing renewable energy plants is an expensive business and is dependent on stable long-term power prices to service the considerable levels of finance required upfront. If the wholesale power prices decrease too far, the economics can fail and renewable energy generators can face financial ruin. Added to this is the risk than no additional renewable energy facilities will be developed as the revenues no longer support this business case. In short, the pace of our continuing transition to a low carbon economy would slow and potentially stall altogether.
The solution to this lies in our ability to ‘balance the load’. Essentially storing excess electricity when low carbon electricity generation exceeds the demand, and then releasing it when the demand exceeds the supply. This can be short term (such as daily fluctuations) as well as long term (suppling low carbon power in the extended periods of low wind speeds). The ultimate aim being to create a permanent supply of low carbon power, and by extension low power prices, without volatility. This not only restores the economic building blocks required for the future development of more low carbon generation, but also means that the UK will no longer need to rely on gas and coal to switch on when low carbon supply is not available, thereby removing the horrific spikes in CO2 emissions witnessed in early 2020.
Thankfully the renewables industry is well aware of this challenge but has yet to settle on the best answer. Some have turned to batteries – good for short term balancing, but not a solution for more than a few hours and the raw materials in batteries are far from being environmentally friendly. Others are looking at pump-storage – extremely expensive and very reliant on relatively rare geographical features, but a 100-year solution. Green hydrogen and compressed air are other options being considered. However, it is becoming increasingly clear that all of these are likely to be needed to meet the challenge of delivering a stable supply of low carbon electricity.
Elgar Middleton
Elgar Middleton have been involved in the UK’s transition to a low carbon economy for over 10 years. During this time we have helped our clients raise over £3.2 billion of senior debt for the financing of renewable generation assets, as well as working on over 50 acquisitions and disposals. Our experience encompasses all the renewable sub-sectors and we assist our clients across Europe and Australia from our London and Sydney offices.
We recognise that whilst the UK has achieved so much in the last decade, much remains to be done. The need to ‘balance the load’ is just one of these challenges and is one that we are already playing a role in. The solutions outlined earlier are all ones that we have extensive knowledge of and are actively working with clients to deliver.
Footnote – A word on subsidies
Whilst this analysis demonstrates a clear correlation between the carbon intensity of the power being generated to the wholesale price paid for that electricity, it should be noted that this is not the full picture. To say that green power is cheap wholesale power is a different statement to saying that it is the cheapest power for the retail consumer. The missing part being the subsidy support that many generators of low carbon power receive. For solar and onshore wind, this takes the form of either the Feed in Tariff or Renewable Obligation Certificates, where in both cases the generator is paid a pre-determined subsidy for every kWh delivered to the grid on top of the wholesale price received for that same kWh. For offshore wind a Contract-for-Difference is used whereby the subsidy guarantees a fixed wholesale price that the generator receives per kWh, so they are in effect topped-up when the wholesale price dips below the agreed ‘strike price’ although they also pay a rebate when the wholesale power price exceeds this level. This traditional (transitional) approach of relying on these government subsidies de-risk projects for the generator but serves to increase the cost differential between the wholesale power price and the retail power price.
However, these subsidies no longer apply to new onshore wind and solar installations as the costs of construction have decreased to such an extent that the projects are financially viable without any subsidy support. This does however mean that these new installations are fully exposed to the volatility in the wholesale power price demonstrated in this article and hence the need for load balancing to dampen these peaks and troughs is a crucial component for their successful deployment.