Introduction
In a recent FT interview, the bestselling author of “Homo Deus” and “Sapiens”, Yuval Noah Harari remarked that the COVID pandemic is no longer a natural disaster but a political one. Furthermore, it has revealed the inability of national governments and institutions to coordinate and act in unison to prevent a global disaster. And while we are still battling one disaster, another one is unfolding beyond a tipping point: climate change.
In the next few paragraphs, we will attempt to zoom out of the current M&A and financing transaction frenzy keeping us busy and briefly assess the high-level context renewable energy projects on the path of decarbonization.
To do this we have selected a few key insights from Bill Gates’ latest book: “How to Avoid A Climate Disaster”, published earlier this year.
A long story short: Summary
The book makes a meaningful contribution to the current climate change action debate in at least two distinctive ways.
Firstly, it provides a simple and clear overview of the relative contribution to global CO2e emissions from several areas of our lives (electricity, construction, transport, etc.). Secondly it provides directions of how emissions can be reduced over a 30-year horizon and what action stakeholders can take to address an obvious shortage in climate technology innovation.
The main theme is that avoiding a climate disaster is a combination of two factors: adaption and mitigation, with 80% of the chapters focused on mitigation. The fundamental message is that all efforts should be focused on eliminating approximately 51 billion tons of C02e (equivalent emissions) p.a. from today’s emissions by 2050.
The author makes a clear point that efforts to (only) reduce emission by 2030, such as replacing coal with gas generation or petrol cars with diesel/hybrid, are in fact counterproductive as they are not only insufficient to enable humankind to achieve a full emission elimination but represent a different social and technological trajectory than decarbonization by 2050. Therefore, decarbonization focus and targets should be assessed on the basis of their contribution to the “zero emission by 2050” target and not merely a reduction effort.
The below paragraphs will summarize several of the book’s chapters but omit a significant part of insightful advice provided in the book on adaptation / government policy and personal contribution. We consider the practicality of those ideas both highly relevant and relatable.
What are the consequences of delayed action?
Before we provide a short list of the what the social and economic costs of a delayed response might be, let us first consider what the impact of COVID-19 related economic curtailment is. It turns out CO2e [1] emission levels have reduced [2] by approximately 2-3 billion tons or just less than a 6% reduction in required levels.
This is not encouraging at all, in particular given that the increased economic activity projected for 2021 is already expected to compensate for some of those saved emissions.
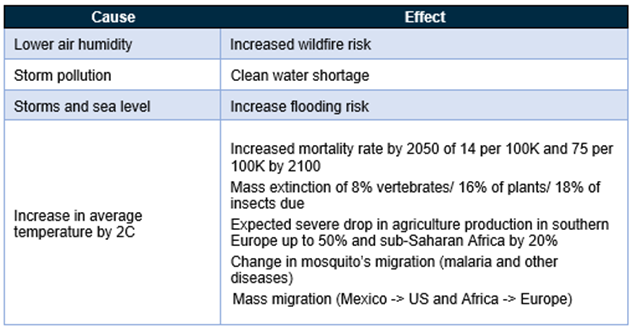
A lot has been said about the consequences of pandemic related, cause-effect relationships, so here is a reminder taken from the book, of some social, political and demographic consequences, which hopefully resonate even more in a post-pandemic world:
How can the financial impact of climate change be quantified?
The book puts forward a simple model that approximates the impact of climate change [3] to the US economy to be roughly equivalent of the effect of one COVID-19 pandemic once every 10 years. This is equivalent to a reduction of approximately 1-1.5% in US GDP per annum or an approximate GDP reduction of USD 2-3T every 10 years.
Considering the scale of the potential financial impact, what part of this cost is already priced in by the global equity and debt markets?
It seems the answer is “not much” – at least according to PGIM’s David Hunt and Taimur Hyat. In “Megatrends- Weathering-Climate-Change Spring 2021” they consider the possibility of a “climate change Minsky moment”, leading to a sharp and disorderly repricing across all asset classes at an approximate cost of USD 20. Their estimations are that the equity and bond premium in many sectors are inadequately reflecting the associated (local) climate risks. In particular municipality / state (Miami / Florida) and sovereign debt rating (e.g. Bangladesh, California) seem to be non-representative of the impact of local weather events. To what extend might a major repricing of sovereign bonds, even if it doesn’t result in non-payment defaults, lead to cross contamination of global fixed income markets remains to be seen. Historical references (e.g. “Asian Contagion”, “Russian financial crisis”) might offer insights. Equity asset repricing risk, according to the authors is high, with additional equity market discount of approximately -200bps for Indian equities and -50 bps for Chinese equities not captured in current stock prices.
These estimates also ignore all the significant economic cost associated with increased inequality, humanitarian cost of deaths.
What needs to be done?
So, if the target is to remove 51B tons of CO2e per year, Bill Gates’ team suggest that there are two ways to achieve this. One seems plausible and the other less so, but let’s start with the easy answer first: Direct Air Capture (“DAC”).
DAC is a largely unproven technology for capturing CO2 directly from the air and currently pegs at a cost of USD 200 per ton of captured CO2. Capturing approximately one C02 molecule out of 2500 air molecules is less efficient compared to direct point capture, which can result to up to 90%, but CCS (carbon capture and storage) technologies have hardly been a success story historically and more importantly, only energy generation emissions can be subject to CCS point capture.
So, removing 51B tons per year at USD 100 (50% lower than the current cost) will be equal to USD 5.1T per year. For reference this is the GDP of Germany (3.86T) and Spain (USD 1.4T) together. Joe Biden’s “American Jobs Plan” infrastructure plan envisages spending USD 2T over 8 years, funded over tax increases over 15 years!
Even if it was technologically feasible the cost might be prohibitive.
Let’s move on to the second – also difficult – but more realistic option: emission reduction. Where do most emissions come from?
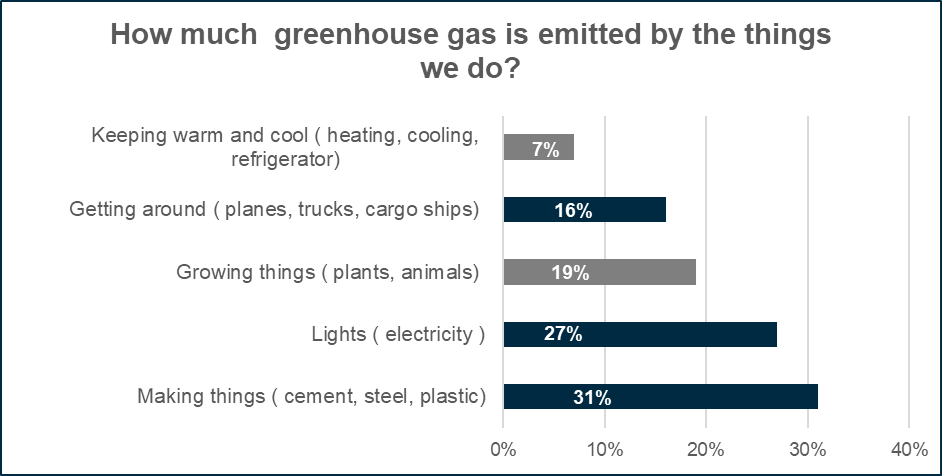
The next sections will focus on a few ideas on how to tackle three of them
How we make things (Manufacturing): 31% of total emissions
Having such a high proportion of emissions attributed to one sector might be considered good news as progress should be quick. Unfortunately, the ability to decarbonize the production of cement, steal, plastic and aluminum is rather complex.
Making cement contributes approximately 1 ton of C02e per ton of cement, and with approximately 5Bn metric tons produced in a year it responsible for the same emission intensity as steel production which is twice as intensive at 1.8t CO2/ 1t. Both together contribute more than 10Bn tons of CO2 emissions per year (approximately all the CO2 emissions of China p.a.).
Steel and aluminum production can be zero carbon if electrified (for example via molten oxide electrolysis) and so can plastic production – if produced from captured carbon and added heat.
There is potential for reduction of cement emission of up to 70%, but it comes at a relatively high premium. One approach might be to add captured “recycled” carbon to calcium oxide in the cement production process. Another, more theoretical one, is the production of cement from seawater, but even those would not enable 100% clean cement.
How much higher will the cost of these goods be if we need to decarbonize immediately:
-
- Plastic – Cost increase: +10-15% to USD 1115/t
- Steel premium – Cost increase: +16-29% to USD 850-1000/t
- Cement – Cost increase: 75-104% to USD 220-300/t
How we plug in (Electricity): 27% of total emissions
Not surprisingly a transition to low carbon generation seems to be key and for most developed nations (such as the US & EU) a transition to a 100% green grid will come at an increase of 15-20% (or USD 13 a month) in power bills per household per year. The problem of course is the rest of the world and developing countries in Asia (India, Indonesia, Vietnam, Pakistan) and Africa. Their Green Premium Costs at the moment are disproportionally higher, hence their slower ability to decarbonize. On the other hand, if they follow China’s coal energy generation path, a climate disaster will be unavoidable.
The book goes very briefly into dealing with the intermittency of renewable generation, but the author admits that its more the seasonal intermittency that’s problematic.
Also, unsurprisingly, the book mentions a technology that the author has been supporting for at least a decade: nuclear fission (not to be confused with nuclear fusion). We should mention that fission reactors are 15x more efficient in using construction materials (cement and glass) than solar and 10x more efficient than wind and approximately 400x less deadly than coal and 40x less deadly than gas. Could and should nuclear be a fundamental part of the energy mix of the future? According to Bill Gates, the answer is a resounding “Yes”. Many might disagree.
Herewith, the solutions proposed for reducing emission in energy generation are rather straightforward: a) more investment in interconnection and distribution networks, b) more offshore wind/solar, storage, cheap hydrogen / thermal storage and in the meantime, carbon capture, and, last but not least, c) reduced energy usage and ramping up of energy efficiency measures.
How we get around: 16% of total emissions
Transport is only the fourth biggest contributor of emissions but is currently receiving a lot of attention. The emission breakdown is as follows:
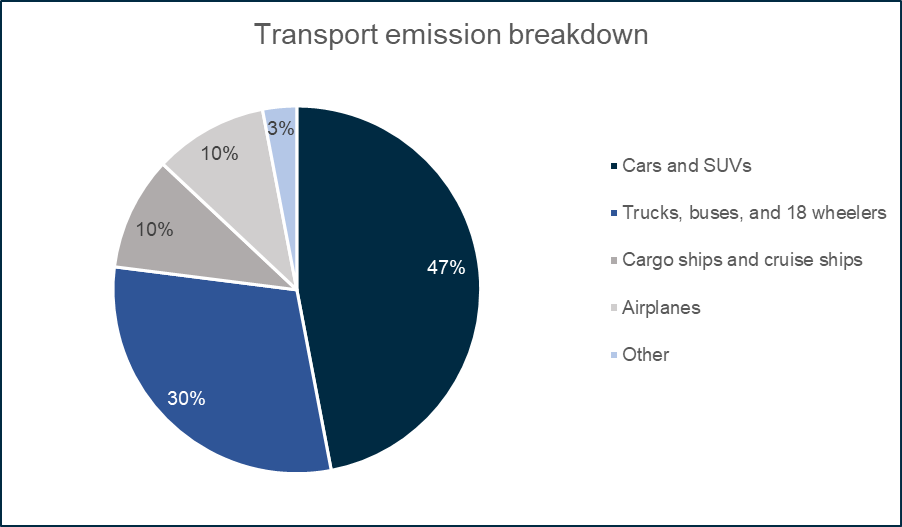
Gasoline’s “Green premium” of USD 2.43/gallon to USD 5/gallon is equivalent to a 100% increase if we replace petrol with advanced biofuels or USD 8.2 (350%) if we employ electro fuels (hydrogen + carbon). Trucks, buses and planes are subject to approximately the same premiums.
Container ships currently have a fuel cost below USD 1.29/L so an equivalent fuel increase of 326% / 600% increase might suggest why they will decarbonize last.
Quick word on electro fuels, which are produced from (clean) hydrogen with added carbon and include biodiesel, methane and butanol. These are obviously interesting as a carbon recycling idea but considering the immense cost of producing clean hydrogen and carbon capture, it seems like electric vehicles (“EV”) or hydrogen itself will be much more efficient.
So, the solutions here seem to be to drive less or failing that, encourage more EVs and increase effort to improve biofuels or electro fuels to lower the green premium.
The role of innovation and R&D
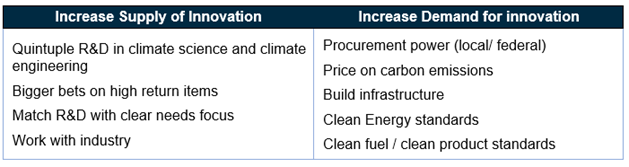
Unsurpisingly, almost all of the proposed solutions rely on upgrades in technology or significant improvements in industrial or manufacturing processes. The speed of these improvements depends to a large extend on the priority and incentives these types of technological innovations receive from policy makers at state/federal or local level.
The message from the book is that efforts in developing technological solutions are currently insufficient and more public support is required both to increase the supply and demand for innovation in clean technology in the following areas:
Conclusion
The above summary captures only about half of the book. To gain the full picture including the areas of heating, cooling, agriculture, adaptation and government and consumer behaviour changes, we do recommend getting a copy of this well researched and very readable book.
We found the high-level breakdown of C02e emissions combined with the impact of different solutions to be straightforward and helpful in contextualizing the effort required to reduce emissions and reduce the impact of climate change.
A clear theme explored through the book is that electrification of different sectors (transport, industrial processes) combined with sufficient cheap green energy generation is one the most viable ways to decarbonize the global economy by 2050. The continuous reduction in LCOEs we’ve observed over the last decade is a significant contributor to this, but so is the application of lessons learned from the early days of wind and solar in Europe and the US.
Sometimes we might have the tendency to think that the future ahead of us is deterministic, i.e. renewables will displace coal, EVs will replace petrol cars, and the planet will avoid a climate disaster. Such deterministic confidence is often a product of hindsight bias and probably highly inaccurate. Hopefully it is a product of our “stubborn optimism” [4] and not complacency.
These positive future outcomes of the world we must create are indeed very much determined by the actions of companies, communities and individuals today, as well as their alignment with the task to narrowly steer away from a global scale climate disaster within our lifetime. The stakes and our responsibility to avoid a climate change disaster could not be any higher.
On Elgar Middleton
Elgar Middleton have been involved in the global transition to a low carbon economy for over 10 years. During this time, we have helped our clients raise over £3.5 billion of senior debt for the financing of renewable generation assets, as well as working on over 50 acquisitions and disposals. Our experience encompasses all the renewables sub-sectors and we assist our clients across Europe and Australia from our London and Sydney offices.
Footnotes
[1] CO2e (equivalent) here will refer not only to C02 emissions equivalents but also include nitrous oxide and methane. In the case of methane, a greenhouse gas 120x more potent than CO2
[2] Period from Q1 2020- Q1 2021
[3] By the year 2050
[4] See “The Future We Choose” by Christina Figueres and Tom Rivett-Carnac